
Could your current marketing strategy be obsolete by 2026 because you’re targeting the London of yesterday? The city’s demographic map is shifting rapidly; relying on outdated assumptions often leads to wasted budgets and missed opportunities. You likely find that interpreting raw ONS data is a frustrating task, especially whilst trying to predict which boroughs are growing or shrinking. It is difficult to know exactly where your ideal customers live amongst the complex layers of the capital’s postcodes.
We understand that precision is the only way to ensure your message lands on the right doormat. This guide will help you master london postcode demographics for marketing so you can identify high-value areas and execute high-ROI leaflet campaigns with confidence. We’ll examine the critical differences between inner and outer London density and provide a clear list of target postcodes for your next campaign. You will gain a reliable framework to turn complex data into a systematic distribution plan that prioritises accountability and delivers tangible results.
Key Takeaways
- Learn why postcode sectors are the essential unit for precise targeting, allowing you to reach specific households rather than wasting budget on broad districts.
- Master the use of london postcode demographics for marketing to align your messaging with local social grades and household tenure across diverse boroughs.
- Understand the 2026 population shift from the centre to the outer ring and how to balance high-density drops with suburban growth areas.
- Identify sector-specific strategies for industries like estate agency and leisure to capture high-churn or young professional audiences in key postcodes.
- Gain full visibility over your investment by using GPS-tracked delivery reports to verify that every targeted postcode is reached with precision.
Understanding the London Postcode Map for Marketing
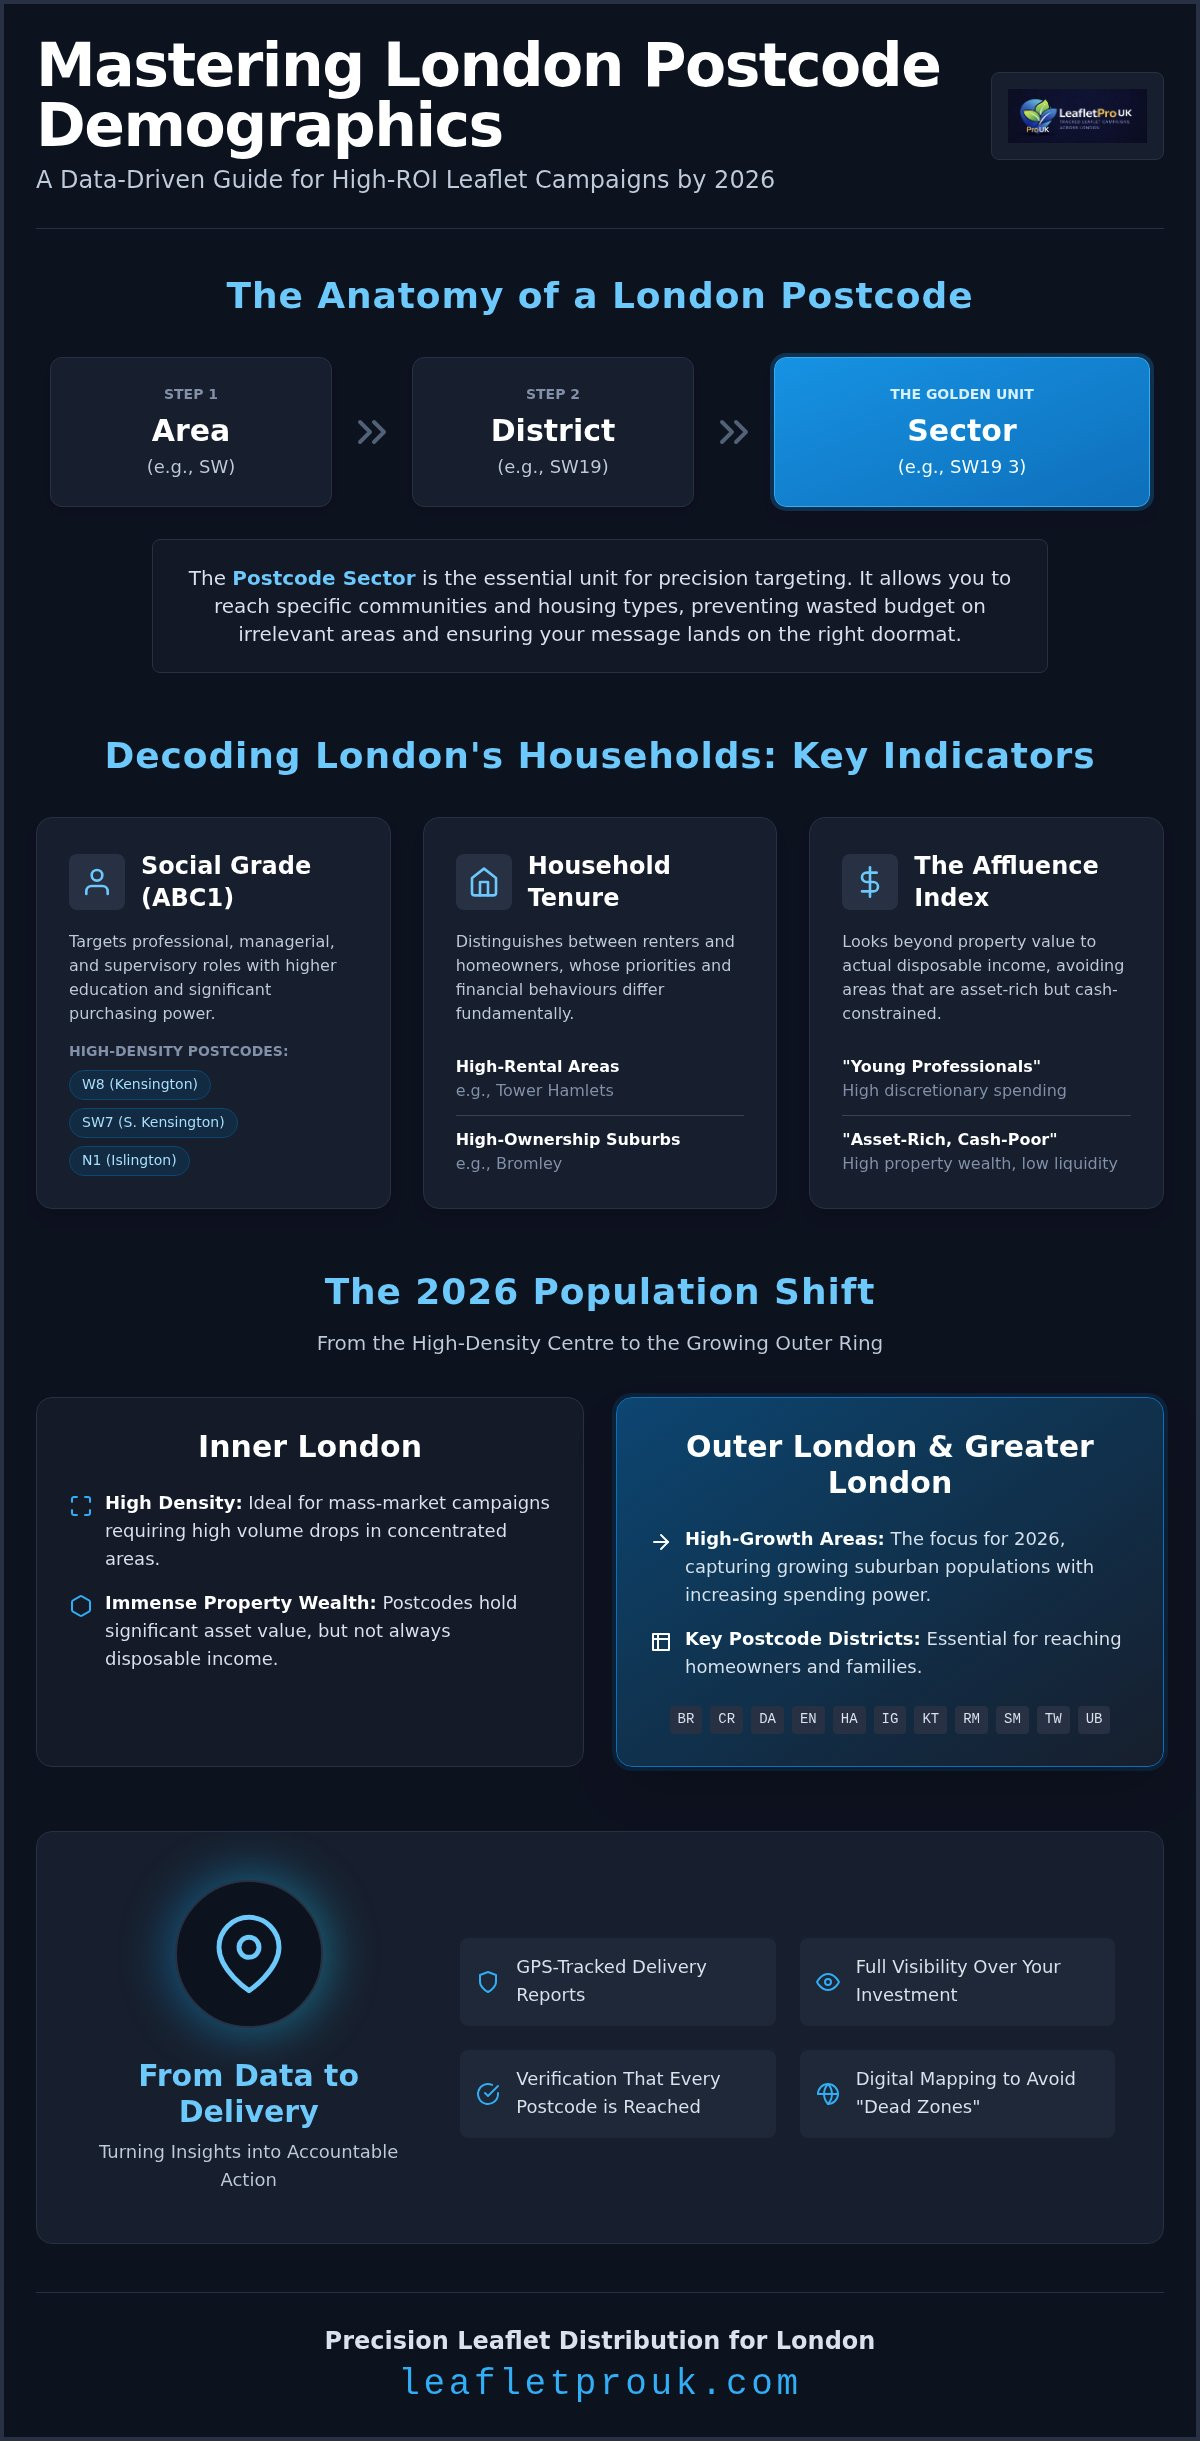
To master london postcode demographics for marketing, you must first understand the structural hierarchy of the capital’s mailing system. It is a system built for logistics, yet it provides the most reliable framework for targeting specific household types. London is divided into eight primary compass-based areas: N, E, SE, SW, W, NW, WC, and EC. Within these areas, the hierarchy drills down from the Area (e.g., SW) to the District (e.g., SW19), and finally to the Sector (e.g., SW19 3).
We consider postcode sectors the “golden unit” for distribution. Whilst a district might cover a broad range of residents, a sector often represents a specific community or housing type. This level of granularity prevents you from sending luxury brochures to industrial zones or student housing. It is also a common mistake to assume postcode boundaries align with local authority boroughs. In reality, they often overlap. This makes raw ONS data difficult to use for marketing without expert interpretation, as a single borough’s statistics might be split across several different postcode districts.
Postcode Areas vs. Postcode Districts
A Postcode Area like SE (South East) is far too broad for a targeted campaign. It covers everything from high-density urban flats to quiet suburban streets. Most successful marketing budgets are allocated at the District level, where you can begin to see clear demographic patterns. However, you must also account for the “out-of-London” postcodes that are technically within Greater London. These include BR (Bromley), CR (Croydon), DA (Dartford), EN (Enfield), HA (Harrow), IG (Ilford), KT (Kingston), RM (Romford), SM (Sutton), TW (Twickenham), and UB (Uxbridge). These areas are essential for brands looking to reach growing suburban populations in 2026.
Visualising Your Target: Maps and Boundaries
Effective distribution requires more than just a list of codes. You need to visualise the physical layout of your target area to ensure maximum efficiency. Using digital mapping tools allows us to overlay london postcode demographics for marketing onto delivery routes, ensuring we avoid “dead zones” such as large parks or industrial estates where no letterboxes exist. This level of precision ensures your budget is spent only on residential properties with the highest potential for conversion.
Our approach relies on GPS tracked leaflet distribution to ensure these boundaries are strictly enforced during the delivery process. This systematic verification provides the peace of mind that your campaign has reached the exact households you intended to target. By mapping the terrain before the first flyer is delivered, we eliminate the uncertainty often associated with large-scale London campaigns.
Key Demographic Indicators: Affluence, Tenure, and Social Grade
Successful campaigns rely on more than just location; they require a deep understanding of the people behind the letterboxes. When analysing london postcode demographics for marketing, we categorise households based on social grade, tenure, and disposable income. These indicators dictate not only where you should distribute but also the tone and offer of your marketing material. A message that resonates in a high-rental area like Tower Hamlets will likely fail in a high-ownership suburb like Bromley because the residents’ priorities and financial behaviours differ fundamentally.
In 2026, the “Affluence Index” is a critical tool for distinguishing between high property values and actual disposable income. Some central districts possess immense property wealth but house residents who are asset-rich yet cash-constrained. Conversely, emerging “Young Professional” belts often feature high levels of discretionary spending despite lower equity. Identifying these nuances ensures you don’t waste your budget on areas that look wealthy on paper but lack the liquidity to engage with your brand.
The ABC1 Household Volumes in London
The ABC1 social grade remains the benchmark for luxury brands and professional services. This category includes residents in professional, managerial, and supervisory roles who typically possess higher education levels and greater purchasing power. Postcodes such as W8 (Kensington), SW7 (South Kensington), and N1 (Islington) maintain the highest density of these households. To engage this audience, your leaflet design must reflect their status through minimalist aesthetics, high-gsm paper stock, and sophisticated typography that avoids aggressive sales language.
Tenure Profile: Renters vs. Homeowners
Household tenure is perhaps the most overlooked factor in London distribution. Projections for 2026 indicate a continued rise in private renting within outer boroughs, creating a transient but high-spending demographic. If you’re a tradesman offering roofing, extensions, or solar panel installations, your efforts must be focused exclusively on homeowners. These residents have the authority and motivation to invest in property maintenance, whereas renters will ignore such offers entirely.
You can refine your approach by using household targeted leaflet distribution London to filter your campaign by property type and tenure. This systematic approach ensures that your flyers reach only the individuals with the power to make a purchase. If you’re unsure which tenure profile fits your business, we can help you organise a consultation to align your distribution with the most profitable household data available.
Age demographics also play a vital role in tenure. The “Young Professional” belt, stretching through E8 and SW11, is dominated by high-churn rental sectors. In contrast, “Established Family” suburbs like Richmond or Dulwich are characterised by long-term ownership and stable household compositions. Aligning your product’s life-cycle with these geographic age brackets is essential for maintaining a high ROI.
Inner vs. Outer London: Where High Density Meets Growth
The demographic landscape of the capital is undergoing a significant transformation. By 2026, we expect a continued migration of marketing spend from the traditional central hubs to the expanding outer ring. Whilst central districts once held the monopoly on high-value targets, the “hollowing out” of the centre means that resident numbers in areas like Westminster are declining relative to the suburbs. However, you must account for the “Westminster Effect”; although resident volumes are lower, the value per doormat remains exceptionally high, making it a niche rather than a volume play.
Effective london postcode demographics for marketing now require a balance between density and reach. Central drops in SE1 or EC postcodes offer high density but come with higher logistical costs due to access restrictions. Conversely, the outer boroughs offer the volume needed for broad brand awareness. We are seeing rapid population growth in boroughs like Tower Hamlets and Barking & Dagenham, where new residential developments are creating thousands of fresh opportunities for local businesses to engage with households.
The Growth Postcodes of 2026
East London continues to lead the way in residential expansion. Infrastructure projects like the Elizabeth Line have fundamentally shifted the demographic maps, making postcodes like E14, E16, and E20 more accessible and attractive to high-earning professionals. This growth directly impacts distribution availability. In these high-demand sectors, “Solus” distribution is often the preferred choice to ensure your brand stands out amongst the influx of new residents, rather than being lost in a “Shared” delivery round.
Accessing High-Density Urban Environments
Reaching households in high-density areas like SE1 or E14 presents unique logistical challenges. Apartment blocks and gated communities often require specific access codes or concierge permissions. Without a systematic approach, these “vertical streets” can become missed opportunities. This is why GPS tracking is a non-negotiable requirement for modern campaigns; it provides the verification that your distributors have successfully reached every floor.
Our verified flyer distribution London service is designed to overcome these urban hurdles. We use precision mapping to ensure that high-density drops are executed with the same level of accountability as suburban rounds. By prioritising transparency and logistical excellence, we ensure your message reaches the right households, regardless of the architectural complexity of the postcode.
Sector-Specific Postcode Targeting Strategies
Applying london postcode demographics for marketing requires a tailored approach that aligns with your specific industry goals. Data alone doesn’t guarantee success; it’s the strategic application of that data that drives ROI. We’ve observed that the most successful campaigns don’t just target wealthy areas, they target the right mindset and lifestyle within those areas. Whether you’re an estate agent looking for high-churn sectors or a local restaurant building a loyal neighbourhood following, your postcode selection must be methodical.
Estate agents often find the highest returns by targeting postcodes with high transaction volumes and “Recently Sold” activity. Similarly, gyms and leisure providers should focus on “Young Professional” density. Areas like N1 (Islington), E8 (Hackney), and SW11 (Battersea) are prime examples where high-disposable-income renters seek local lifestyle services. For high-end home improvement brands, the focus shifts to established “Wealthy Suburbs” such as Richmond (TW9) or Dulwich (SE21), where property owners possess both the equity and the desire for long-term renovations. Local restaurants, meanwhile, should adhere to the 2-mile radius rule. Slighting your budget across a broad area is less effective than achieving total saturation within the immediate postcode sectors surrounding your venue.
Leaflet Distribution for Tradesmen
For tradesmen, identifying postcodes with older housing stock is the most reliable way to find households requiring ongoing maintenance. Victorian and Edwardian terraces in the SW and N districts often have higher demands for roofing, plumbing, and electrical upgrades than newer developments in the East. These “affluent but busy” households value reliability and professional standards above all else. You can find more specific growth tactics in our guide to leaflet distribution for tradesmen London, which focuses on aligning your service with these high-demand residential pockets.
Retail and Hospitality Targeting
Driving footfall to new London openings requires a clear distinction between the “Daytime Population” and the “Resident Population.” The City (EC postcodes) is a classic example of this trap. Whilst thousands of professionals occupy these streets during work hours, the actual resident count is relatively low. If your business relies on evening or weekend trade, you’ll find much better results targeting the residential belts of Hackney or Lambeth. You can use a how to target postcodes for leaflet distribution London checklist to ensure your campaign remains focused on the highest-potential households at the right time.
Turning Data into Deliveries with GPS Tracking
Identifying the most profitable london postcode demographics for marketing is a vital first step, but data alone doesn’t guarantee your flyers reach the right doormats. The most sophisticated demographic map is only as effective as the physical distribution that follows it. Without rigorous accountability, the precision of your targeting can be lost during the final mile of delivery. We bridge this gap by turning abstract data into a systematic, verified process that ensures your investment is protected through every stage of the campaign.
Our approach moves beyond simple delivery by integrating demographic insights with logistical proof. We don’t just tell you which postcodes are growing; we provide the evidence that those specific areas have been thoroughly covered. This transition from planning to execution is where many campaigns fail, often due to a lack of visibility over the distribution staff. By prioritising transparency, we allow you to launch your campaign with the confidence that your message is being handled with the same level of care you put into your brand’s strategy.
The Role of GPS Accountability
In 2026, GPS tracking has become the non-negotiable security standard for London marketing. A GPS report isn’t just a map; it’s a verification tool that shows the exact path taken by a distributor, right down to the individual street and household level. When you review these reports, you can see the precise coverage of your chosen postcode sectors, ensuring no “dead zones” were left untouched. This level of scrutiny allows us to identify and correct any potential gaps in real-time, providing a layer of accountability that traditional, unmonitored distribution simply cannot match. It’s the difference between hoping your flyers were delivered and knowing they were.
Launching Your Demographic-Led Campaign
Launching a high-ROI campaign requires a seamless transition from postcode selection to final reporting. The process begins with our demographic analysis, where we help you isolate the sectors that match your ideal customer profile. Once the targets are set, the focus shifts to high-quality printing. It’s essential that the physical leaflet matches the expectations of the chosen demographic; an affluent household in Richmond expects a different tactile experience than a young professional in Hackney. We manage this end-to-end journey to ensure your brand’s credibility remains intact from the first design proof to the final letterbox drop.
Once your flyers are in the field, you’ll receive a comprehensive delivery report that closes the loop on your campaign. This systematic workflow ensures that your marketing efforts are grounded in evidence rather than guesswork. By combining precise london postcode demographics for marketing with GPS-verified execution, you create a reliable engine for local growth that delivers tangible, traceable results.
Future-Proof Your London Marketing Strategy
Success in the capital’s evolving landscape depends on moving away from broad generalisations and towards sector-level precision. By mastering london postcode demographics for marketing, you can navigate the shifts between central hollowing and suburban growth with absolute confidence. This ensures your budget is spent only on households that align with your specific social grade and tenure targets. Precision is paramount in a city where every street tells a different story.
We provide the specialist London knowledge and professional design integration needed to turn these insights into high-ROI campaigns. Every distribution includes GPS-tracked proof of delivery; this gives you the visibility and peace of mind that your investment is being handled with systematic care. You don’t have to guess where your message lands when you have verified data as your foundation. Our end-to-end service ensures your brand’s integrity remains intact from the initial print run to the final letterbox drop.
You’re now equipped to transform complex demographic data into a tangible growth engine for your business. We look forward to helping you reach the right doormats across the capital with precision and reliability.
Frequently Asked Questions
What is the most affluent postcode in London for marketing?
W8 (Kensington) and SW7 (South Kensington) remain the most affluent postcodes when measured by property value and social grade density. However, for a high ROI, you should also consider districts like SW19 (Wimbledon) where disposable income is exceptionally high amongst established families. We use london postcode demographics for marketing to identify these pockets of wealth, ensuring your campaign reaches residents with the liquidity to engage with premium services rather than just asset-rich homeowners.
How many households are in an average London postcode sector?
An average London postcode sector contains approximately 2,000 to 3,000 households. This specific unit is ideal for distribution because it is small enough to maintain demographic homogeneity whilst being large enough to provide cost-effective volume. When we help you select sectors, we look for clusters that share similar housing types and social grades. This methodical approach allows for a more predictable response rate compared to targeting entire districts or broad council boroughs.
Where can I find the most recent London demographic data for 2026?
The most reliable sources for 2026 projections are the Office for National Statistics (ONS) and the Greater London Authority (GLA). These organisations provide raw data on population shifts and housing tenure. We take this complex information and translate it into actionable london postcode demographics for marketing. By overlaying current growth trends onto mailing maps, we help you identify which residential sectors are expanding and which are becoming less relevant for your specific business goals.
Which London boroughs are currently seeing the highest population growth?
Tower Hamlets and Barking & Dagenham are currently experiencing the highest population growth in the capital. These areas are benefiting from massive regeneration projects and new residential developments that attract young professionals and families. In contrast, central areas like Westminster are seeing a slight decline in permanent resident numbers. Understanding these growth patterns is essential for brands that want to establish a presence in emerging markets before they become saturated by competitors.
Is postcode targeting more effective than borough targeting for leaflets?
Postcode sector targeting is significantly more effective than borough targeting because it offers far greater precision. A single borough like Barnet or Lambeth contains a vast range of social grades and housing tenures. If you target the whole borough, you risk wasting a large portion of your budget on irrelevant households. By drilling down to the sector level, we ensure your message only reaches the specific demographics that match your ideal customer profile.
What is the difference between ABC1 and social grade demographics?
The ABC1 category is a specific group within the wider social grade system that represents the most affluent and professional households. It includes Grade A (Higher professional), Grade B (Intermediate professional), and Grade C1 (Supervisory or junior management). In London marketing, this group is often the primary target for luxury retail and professional services. We use these grades to filter postcode sectors, ensuring your flyers reach individuals with the highest purchasing power and discretionary income.
How do I verify that my leaflets were delivered to the correct postcodes?
You can verify your delivery through detailed GPS-tracked reports that show the exact route taken by every distributor. At LeafletPro UK, we provide these reports for every campaign to offer total transparency and peace of mind. These maps prove that your leaflets reached the intended postcode sectors and that no streets were missed. This level of accountability is the only way to ensure that your demographic targeting strategy is actually executed in the field.
Can I target specific property types within a postcode?
Yes, it is possible to target specific property types by filtering postcode sectors based on housing density and tenure data. If your business provides garden maintenance or roofing, you can focus exclusively on sectors dominated by houses rather than high-rise apartment blocks. This “Precision over Volume” approach ensures that your marketing material is only seen by residents who have the authority and the need to purchase your specific services, significantly increasing your ROI.