
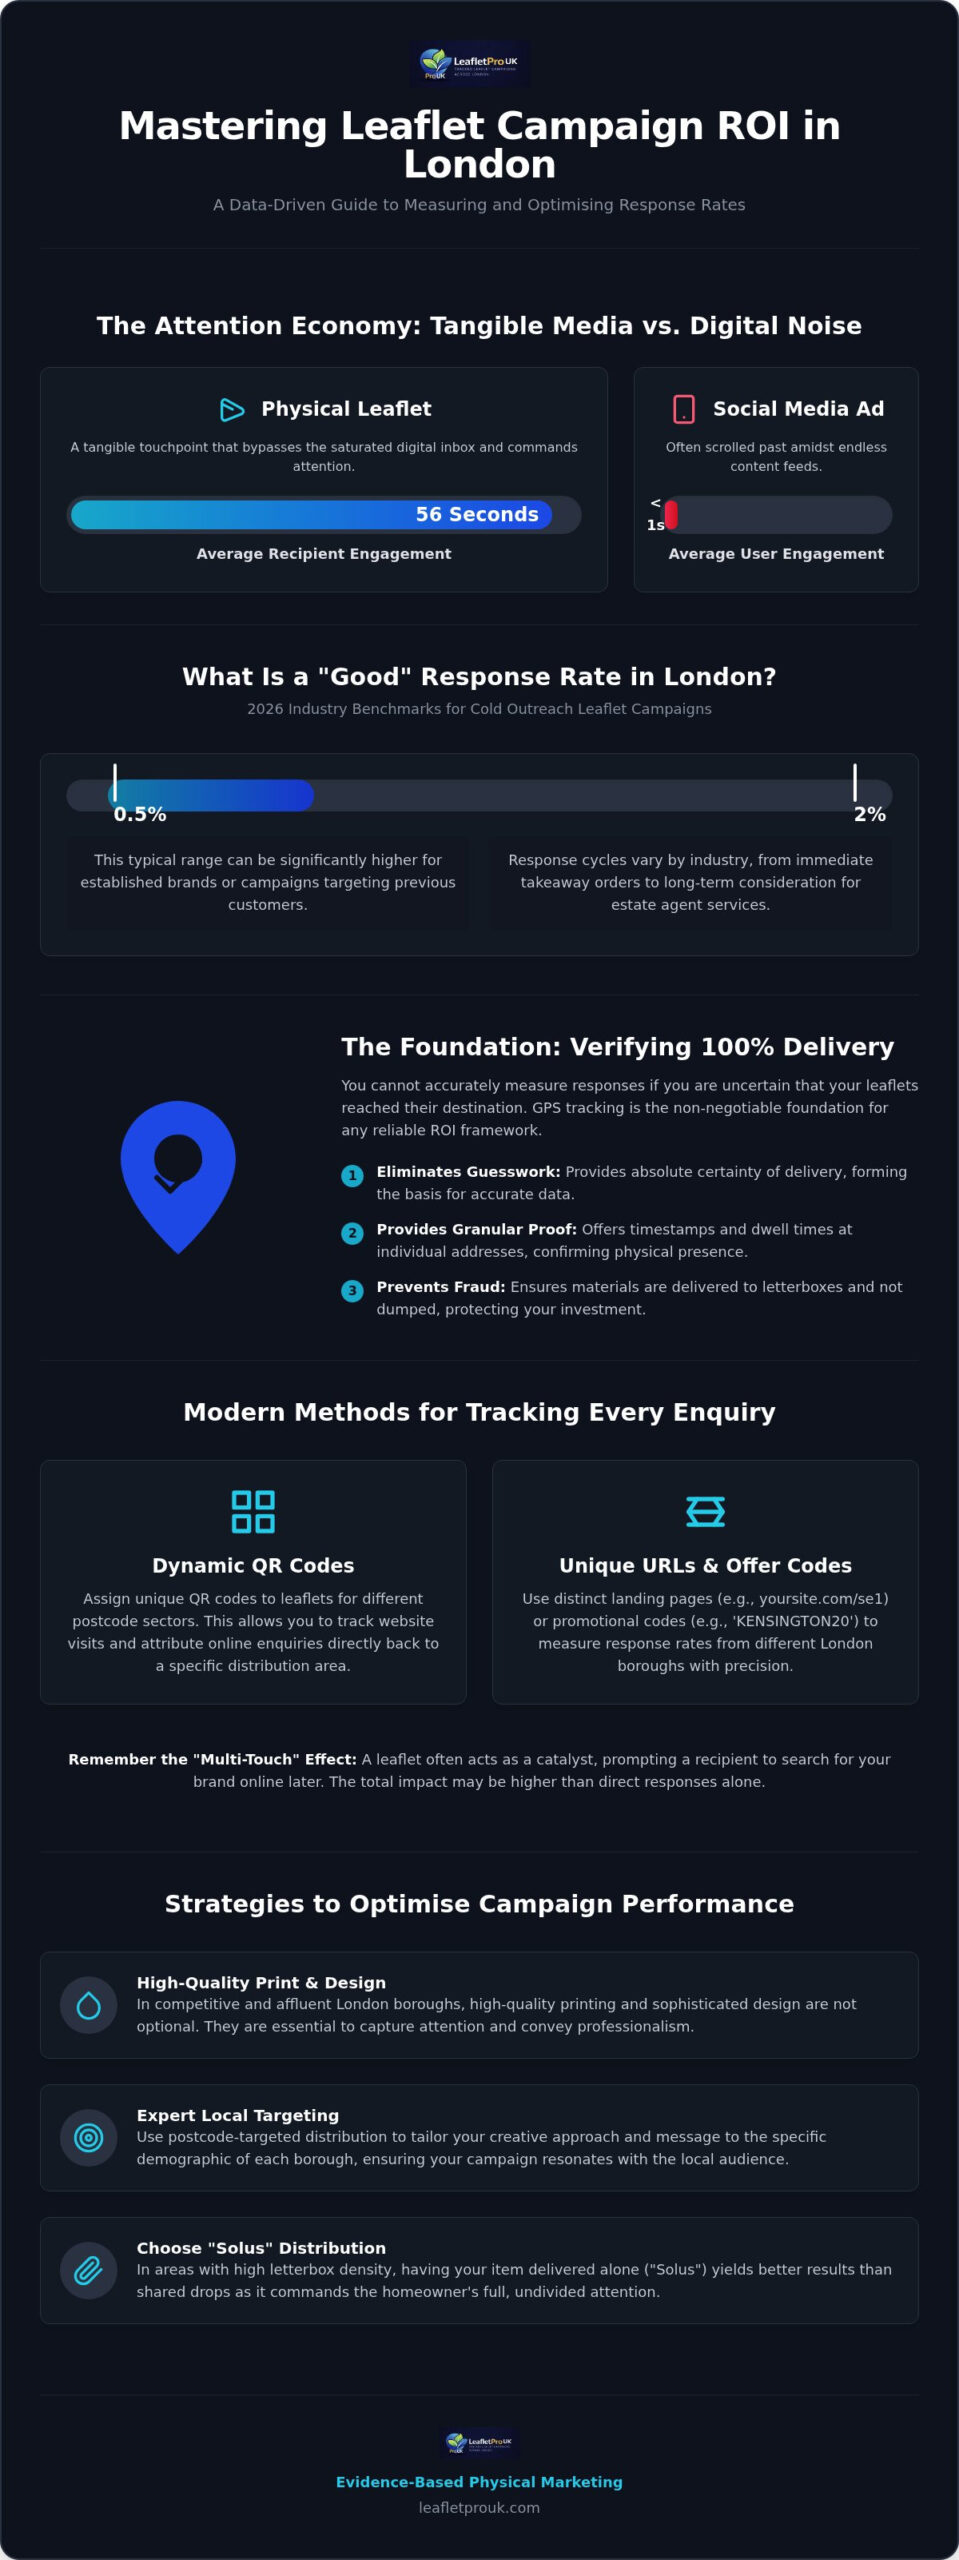
Did you know that a physical leaflet receives an average of 56 seconds of engagement, whilst a social media ad often gets less than a single second? Despite this high level of attention, many businesses still struggle with tracking leaflet distribution response rates London, often fearing their investment has ended up in a recycling bin rather than on a doormat. It’s understandable to feel hesitant when you can’t see the physical path your marketing takes or clearly attribute a new sale to a specific flyer amongst your digital campaigns.
We believe that transparency should be the standard, not a luxury. In this guide, you’ll learn how to master the art of measuring and optimising your London leaflet campaign response rates using GPS data and modern attribution methods. We provide a clear framework to verify 100% delivery and a template to calculate ROI by specific London postcode. You’ll also discover proven strategies to increase response rates in even the most competitive boroughs, ensuring your marketing spend is both visible and accountable. By the end of this article, you’ll have a systematic approach to physical marketing that prioritises evidence over guesswork.
Key Takeaways
- Establish a foundation of transparency by using GPS-tracked delivery data to verify that 100% of your leaflets reach their intended London doorsteps.
- Understand the 2026 industry benchmarks to set realistic expectations, with a 0.5% to 2% response rate being the standard for cold outreach in London.
- Master the modern methods for tracking leaflet distribution response rates London by using dynamic QR codes that attribute enquiries to specific postcode sectors.
- Utilise a professional ROI framework that balances design, print, and distribution costs against the long-term lifetime value of your London clients.
- Optimise your campaign performance by combining high-quality printing with expert local targeting to ensure your message stands out in competitive boroughs.
What is a “Good” Response Rate for London Leaflet Drops?
A response rate represents the percentage of recipients who take a specific action, such as a website visit or a phone call, amongst the total volume of items distributed. For businesses tracking leaflet distribution response rates London, a realistic benchmark in 2026 typically sits between 0.5% and 2% for cold outreach. This figure can rise significantly for established brands or those targeting previous customers. Direct mail marketing statistics suggest that physical marketing remains a resilient channel because it bypasses the saturated digital inbox, providing a tangible touchpoint that consumers can’t simply scroll past.
To better understand how these figures are calculated and what influences them, watch this helpful video:
Modern London campaigns rarely exist in isolation. A physical flyer often acts as a catalyst, prompting a resident to search for a brand online later that evening. This “multi-touch” effect means that while your direct response might be 1%, the overall impact on your digital enquiries could be much higher. Research shows that a physical leaflet receives an average of 56 seconds of engagement, which is significantly higher than most digital alternatives.
London Sector Benchmarks: From Estate Agents to Restaurants
The nature of your business dictates the response cycle. Estate agents in high-value areas like Kensington or Fulham often operate on longer conversion windows, as homeowners may keep a professional flyer for months before deciding to sell. Conversely, a local takeaway in a dense borough might see an immediate spike in orders within 48 hours. Direct Response is defined as any measurable action taken by a recipient that can be immediately attributed to the physical mail piece.
The Impact of London Postcode Density on Visibility
Letterbox density varies wildly across the capital. In postcodes like E1 or SE1, the high volume of apartment blocks and commercial units creates a “clutter” factor that can drown out poorly designed flyers. Choosing a “Solus” distribution, where your item is delivered alone, often yields better results than shared drops because it commands the homeowner’s full attention. There is also a clear correlation between property value and aesthetic requirements; affluent London households expect high-quality printing and sophisticated design. Using postcode-targeted flyer distribution allows you to tailor your creative approach to the specific demographic of each borough, ensuring your message resonates with the local audience.
GPS Tracking: Ensuring Data Integrity Before Measuring Responses
You cannot accurately begin tracking leaflet distribution response rates London if you lack absolute certainty that your marketing materials reached their destination. GPS tracking serves as the non-negotiable foundation for any ROI framework because it eliminates the guesswork associated with physical delivery. Whilst digital ads offer click-through data, direct mail response rates are often cited as being 10 to 30 times higher than digital equivalents. However, these superior returns only materialise if the physical item actually crosses the threshold of a London home.
Professional GPS reports provide more than just a line on a map. They offer a granular view of the distribution process, including specific timestamps and dwell times at individual addresses. This level of detail confirms that a distributor was physically present at the letterbox rather than simply walking past. In a complex urban environment, identifying “blind spots” is equally vital. Expert London distributors use this data to navigate the logistical hurdles of high-rise apartment blocks and gated communities, ensuring that every postcode in your campaign is fully serviced and accounted for.
How GPS Proof Prevents “Dumped” Leaflet Fraud
The logistical reality of London distribution in 2026 means that manual spot-checks are no longer a sufficient method of quality control. The sheer density of the capital makes it tempting for less reputable operators to “dump” leaflets in communal bins or skip difficult streets. GPS data provides the peace of mind required for high-volume campaigns by creating a digital paper trail of every movement. For a deeper look at the technology involved, see our guide on GPS Tracked Leaflet Distribution. This accountability acts as a growth driver, allowing you to validate whether a low response in a specific area was due to poor delivery or a lack of market fit.
Integrating GPS Data into Your Marketing Dashboard
Modern marketing requires the integration of offline and online data. By comparing delivery heatmaps with your enquiry heatmaps, you can quickly identify “Goldmine” postcodes where your message is resonating most effectively. Correlating GPS timestamps with spikes in website traffic or phone enquiries allows for a more sophisticated level of attribution. By providing verifiable proof of coverage, GPS data transforms distribution from an opaque operational cost into a measurable business asset. When you choose a leaflet distribution company that prioritises audited data, you remove the uncertainty from your marketing budget and focus entirely on scaling what works.
Modern Attribution: How to Track Every Enquiry Whilst Maintaining Privacy
Consumer behaviour in London has undergone a significant transformation. By 2026, residents expect a frictionless transition from a physical flyer to a digital platform. Relying on traditional methods, such as asking a customer to “mention this leaflet” during a call, is often imprecise in a city where time is at a premium. To succeed, brands must build a digital bridge that connects the doormat to the screen. This shift makes tracking leaflet distribution response rates London a data-driven exercise rather than a series of educated guesses.
Dynamic QR codes represent the next generation of this bridge. By using unique URLs for different postcode sectors or even specific streets, you can see exactly where your leads are coming from in real-time. This granular data allows you to see which areas of a borough like Wandsworth or Islington are providing the highest engagement. When combined with unique discount codes, you create a powerful incentive for the recipient whilst gaining a precise method for campaign attribution. Dedicated landing pages further enhance this by providing a bespoke experience that matches the local context of the London neighbourhood you’re targeting.
Comparison of Tracking Methods for London Brands
While dedicated phone numbers still have a place, QR codes are often superior for the fast-paced London lifestyle. A resident scanning a code on their commute is more likely to convert than one who has to remember a number to call later. However, you should also monitor “Brand Lift”. This is the measurable surge in organic searches for your business that occurs during and after a drop. To capture the full picture, use post-purchase surveys to identify customers who may have seen your leaflet but navigated to your site through a different channel.
Privacy-First Tracking in the Post-GDPR Era
Organising your data collection with a privacy-first mindset is essential for maintaining trust. Using postcode-level data is a sophisticated way to track performance without needing to store sensitive individual information. This approach is inherently safer and fully compliant with modern regulations. Ensure that your landing pages are perfectly optimised for mobile users, as many Londoners will interact with your brand whilst on the move. Finally, using clear offer deadlines helps to create a sense of urgency and tightens your attribution window, making it easier to link sales directly to your distribution dates. When you work with a professional leaflet distribution service london, they can advise on the best creative layouts to make these tracking elements as effective as possible.
The ROI Tracking Template: A Step-by-Step Calculation Guide
Calculating the success of a campaign requires a shift from focusing on upfront costs to analysing net profitability. When you are tracking leaflet distribution response rates London, the goal is to identify which specific streets generate the most sustainable growth. This methodical approach is why the ROI for businesses using physical marketing has seen an average annual increase of 24% since 2021. To find your true return, follow this four-step framework:
- Step 1: Calculate Total Campaign Cost. This includes the professional design phase, high-quality printing, and the distribution fee. Don’t omit the small costs, as accuracy here is vital for the final percentage.
- Step 2: Define your Customer Lifetime Value (CLV). A single sale from a leaflet might be worth a modest amount today. If that customer returns several times over the next year, their true value to your business is significantly higher.
- Step 3: Deduct COGS from Revenue. Subtract the cost of goods sold or the cost of providing your service from the total revenue generated by the drop. This leaves you with your gross profit.
- Step 4: Find your ROI Percentage. Divide your net profit by the total campaign cost. This figure provides a clear benchmark to compare against your digital marketing efforts.
Postcode-Level ROI Analysis: Identifying Your Best Areas
London is a collection of micro-markets, each with distinct behaviours. SW postcodes often command a higher distribution cost due to the complexity of the terrain, yet they frequently yield a significantly higher CLV than other areas. By using a simple spreadsheet to track responses per 1,000 flyers by London sector, you can see which boroughs deserve a larger share of your future budget. For a deeper look at targeting specific demographics, read our guide on Household Targeted Leaflet Distribution in London.
Optimising for Repeat Drops: The Power of Frequency
A common mistake is treating a leaflet drop as a one-off event. Data suggests that the second or third drop in a London neighbourhood often yields a response rate three times higher than the initial attempt. This happens because 45% of UK households keep leaflets for future reference, building familiarity over time. The Rule of Seven in physical marketing states that a prospect needs to encounter a brand’s message at least seven times before they’re likely to take action. Budgeting for “drip-feed” campaigns allows you to build this trust systematically without overextending your resources.
Optimising Your London Campaign with LeafletPro UK
Successfully tracking leaflet distribution response rates London depends entirely on the precision of the initial drop. Even the most sophisticated ROI framework will fail if the underlying delivery data is flawed. At LeafletPro UK, we specialise in bridging the gap between physical distribution and digital accountability. By focusing exclusively on the London market, we’ve developed a deep understanding of the capital’s unique logistical challenges, from the high-density apartment blocks of Canary Wharf to the suburban residential streets of Richmond. This local expertise ensures that your campaign isn’t just delivered, but is strategically positioned for maximum visibility.
National providers often lack the granular street-level knowledge required to navigate London’s complex geography. We’ve found that a “one size fits all” approach rarely works in a city with such diverse demographics and property types. Instead, we use postcode-targeted precision to ensure your flyers reach the households most likely to convert. Our commitment to transparency means you’re never left wondering about the status of your investment. Every campaign is backed by audited delivery data, providing the peace of mind that comes from knowing your brand is being handled with professional care.
Our Integrated Design and Print Service
The success of your campaign begins long before the first leaflet hits a doormat. To ensure your artwork is “London-ready,” it must be clean, credible, and conversion-focused. Londoners are accustomed to high-quality marketing; therefore, your aesthetic must reflect professional standards to avoid being ignored. We advise on everything from the visual hierarchy of your offer to the optimal paper weight. Choosing a heavier GSM (grams per square metre) helps your flyer stand out amongst the lighter, mass-produced post often found in communal hallway bins. You can explore our full range of creative and logistical solutions on the LeafletPro UK Homepage.
Your Peace of Mind: The LeafletPro Delivery Audit
We organise our teams into disciplined units to ensure 100% coverage across your targeted streets. This systematic approach is verified through our rigorous delivery audit process. Once your distribution is complete, you’ll receive a digital GPS report that details exactly where and when your leaflets were delivered. This report is a vital tool for your next campaign, allowing you to correlate delivery times with spikes in your website traffic or phone enquiries. By analysing these patterns, you can refine your targeting and further improve your response rates over time. Accountability is the cornerstone of our service, ensuring every penny of your marketing budget is working toward a tangible result.
Securing Your Marketing Future in the Capital
Success in the London market requires a move from speculative spending to a model of total accountability. By implementing a framework that prioritises GPS-proven delivery and digital attribution, you ensure every flyer serves as a measurable asset. We’ve explored how 100% verification through route data eliminates the fear of “dumped” mail, whilst professional design support ensures your message resonates in high-density boroughs. Mastering the art of tracking leaflet distribution response rates London allows you to refine your strategy with every drop, turning local postcode intelligence into a sustainable growth engine.
Our specialist London-only distribution team is dedicated to providing the transparency you need to invest with confidence. With end-to-end support covering everything from the initial design to the final audited report, you can focus on managing your new enquiries whilst we handle the complex local logistics. Your marketing budget deserves the protection of evidence-based results and a partner who understands the nuances of the capital’s streets.
We look forward to helping you build a more visible and profitable presence across the city’s most competitive neighbourhoods.
Frequently Asked Questions
What is the average response rate for leaflet distribution in London in 2026?
The average response rate for cold leaflet outreach in London typically ranges between 0.5% and 2%. However, statistics from 2026 indicate that approximately 9.2% of delivered items lead to some form of measurable action, such as a website visit. This disparity occurs because many residents engage with the content but don’t convert immediately. Tracking leaflet distribution response rates London effectively requires looking beyond the initial enquiry to capture the full impact on your brand’s digital search volume.
How does GPS tracking prove my leaflets were actually delivered?
GPS tracking provides a digital audit trail of the distributor’s exact path, including specific timestamps and dwell times at each property. This data creates a transparent map of every street covered, proving the distributor physically approached the letterbox. By reviewing these route reports, you gain the peace of mind that your investment reached its destination. This systematic verification removes the historical uncertainty of physical marketing, ensuring your ROI calculations are based on confirmed delivery data.
Can I track responses without using digital QR codes?
You can track responses using several non-digital methods, such as dedicated phone numbers or unique promotional codes. These identifiers allow your team to attribute a sale directly to the flyer during the enquiry process. Another effective strategy is using post-purchase surveys that ask customers how they discovered your business. Whilst QR codes provide the fastest digital bridge, these traditional methods remain highly effective for capturing enquiries from demographics that prefer direct phone interaction or physical vouchers.
Is solus or shared distribution better for tracking ROI in London?
Solus distribution is generally superior for accurate ROI tracking because your leaflet is the only item delivered to the household. This exclusivity ensures the recipient’s full attention and removes the clutter factor associated with shared drops. Whilst shared distribution is more cost-effective for broad awareness, solus campaigns provide cleaner data for tracking leaflet distribution response rates London. The higher engagement levels of a solus drop often lead to a more predictable and measurable return on investment.
How long should I wait to measure the final response rate of a campaign?
We recommend waiting at least two to three weeks for the initial response spike, though the total conversion window is often much longer. Research shows that 45% of UK households keep leaflets for future reference, meaning you could see enquiries months after the distribution date. To maintain accuracy, you should track responses over a minimum of 90 days. This longer window accounts for the retention effect where flyers are stored until the consumer’s specific need arises.
What London postcodes typically see the highest response rates?
Response rates vary significantly depending on your business sector and the local demographic. High-density areas like E1 or SE1 often produce a high volume of quick enquiries for service-based businesses like food delivery or local maintenance. Conversely, affluent SW postcodes may yield fewer responses, but the lifetime value of those customers is often much higher. Success depends on aligning your offer with the specific property types and household values within each individual London borough.
How much does a GPS-tracked leaflet campaign in London cost?
The cost of a campaign is influenced by several logistical factors, including total distribution volume, the complexity of the targeted postcodes, and whether you choose solus or shared delivery. High-rise developments or gated communities may require more time to navigate, which can influence the total investment. It’s also important to factor in professional design and high-quality printing costs. We focus on providing a transparent structure that balances these variables to ensure your campaign remains profitable and accountable.
Can I target specific demographics within a London postcode?
Yes, postcode-targeted precision allows you to select specific streets or sectors that match your ideal customer profile. By analysing property types and local market data, we can focus distribution on households most likely to engage with your specific offer. This level of granularity ensures your marketing materials aren’t wasted on irrelevant areas. This targeted approach is far more efficient than a broad blanket drop, allowing for a more focused and accountable use of your marketing budget.